
Advanced Device Monitor
NOTE
The Device Monitor is the most powerful engineering tool in LumiotLoRaWAN. It provides a real-time, low-level view of what is happening with a specific sensor, from business telemetry to raw LoRaWAN radio-frequency frame inspection.
To access the monitor, click the "Chart" icon on any device in the Active Devices list.
1. Dashboard (Main Telemetry)
The default view shows the most recent and historical business data.
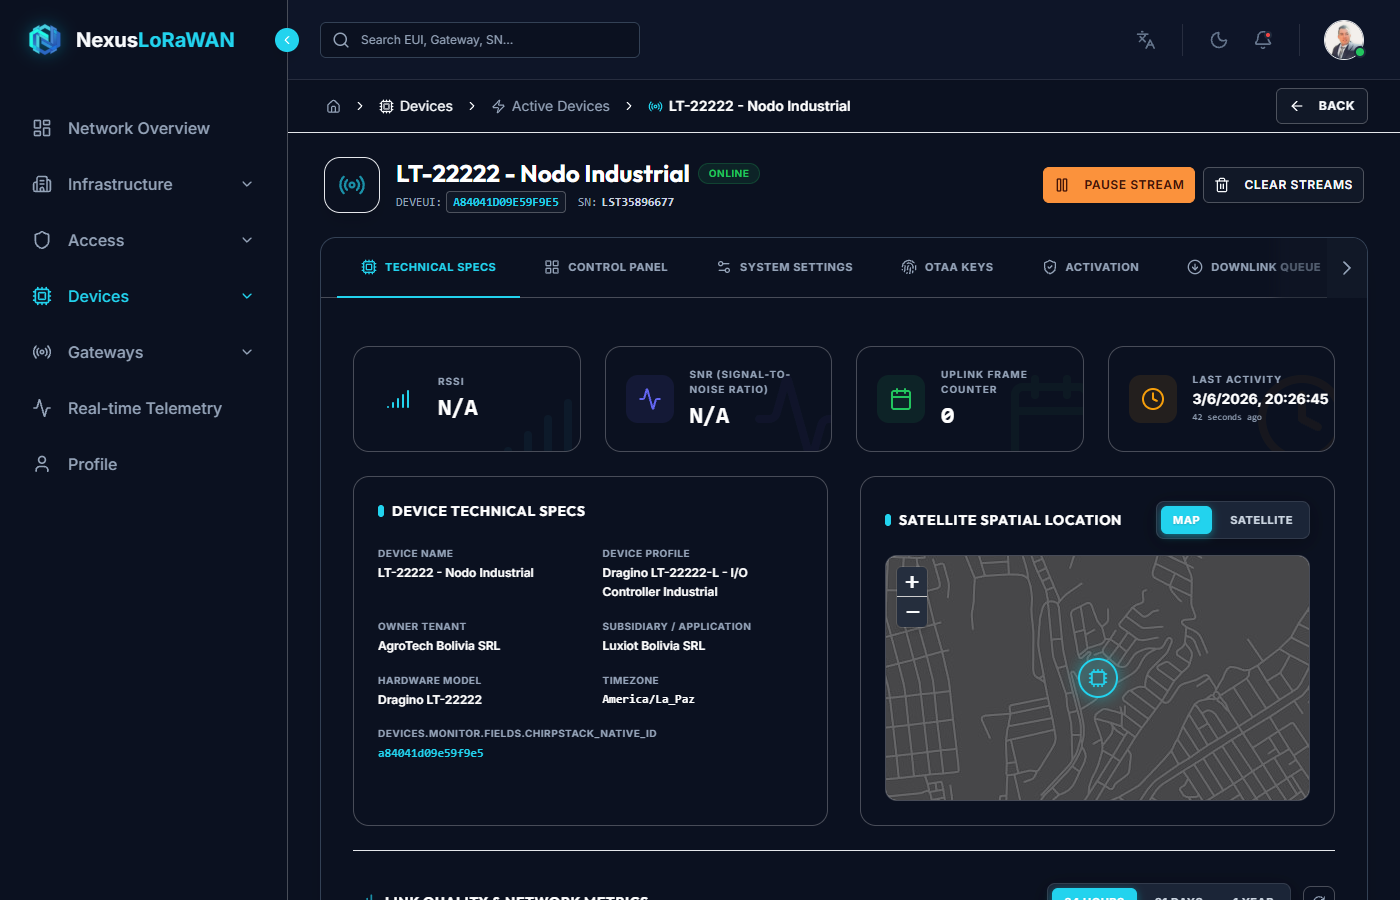
- Live Charts: Real-time graphs automatically generated based on the variables decoded by the Codec (e.g., Temperature, Humidity, Battery). Powered by the high-speed TimescaleDB backend.
- Data Table: Shows the latest payloads received.
- Network Health Metrics: Displays the last
RSSI(Signal Strength) andSNR(Signal-to-Noise Ratio), crucial for determining if the antenna is well positioned.
2. Control (Command Terminal)
A dedicated interface for interacting with the device.
- Allows sending Downlinks in Base64 or JSON format.
- Displays a visual queue of commands pending delivery (waiting for the sensor to wake up and open an Rx window).
3. Config (Settings & Transfers)
Allows adjusting the operational parameters of the active sensor, its name, location, and metadata.
Special Action: Device Transfer By clicking the TRANSFER button, Integrators or SuperAdmins can migrate a sensor from one Subsidiary to another without losing its historical data.
4. OTAA (Activation Parameters)
If the device uses OTAA, this tab securely shows the AppKey and NwkKey. It also allows forcing a new session generation or updating the keys if the hardware was factory reset.
5. Activation (Current Session)
Displays the current active session state (ABP or after a successful OTAA join):
Device Address (DevAddr)Network Session Key (NwkSKey)Application Session Key (AppSKey)- Current Up/Down frame counters.
6. Queue (Pending Messages)
Shows a list of all downlinks that have been sent but not yet acknowledged by the physical sensor (typically because it is in sleep mode, Class A). You can flush the queue from here if needed.
7. Events (LoRaWAN Network Server Logs)
A direct stream of events from the network server. Here you will see:
up: When a payload arrives.join: When the device attempts to connect.error: Failed MIC validations or codec errors.ack: Acknowledgements of received downlinks.
8. Frames (Raw LoRaWAN Packets)
The ultimate debugging tool for network engineers. Displays the raw LoRaWAN frames (PHYPayload) exactly as captured by the Gateway, before any decryption. Useful for analyzing MAC commands (LinkCheckReq, ADR) and routing issues.
9. Metadata
Displays the tags and variables associated with the device context, which are appended to HTTP integrations and MQTT topics for external routing.