
Gateway Monitor
NOTE
The Gateway Monitor view is the direct bridge between your browser and the network core (LoRaWAN Network Server). Utilizing gRPC streams converted to WebSockets in the backend, this console allows you to observe in real-time every radio-frequency frame (Uplink/Downlink) that crosses the physical antenna, along with vital health and spectrum metrics, without needing to reload the page.
1. Tactical Header and Global Controls
At the top of the interface, regardless of which tab you are in, you have a control Hero showing the name, DevEUI, SN, and a dynamic "Badge" (ONLINE/OFFLINE). Additionally, you have the following global buttons:
- 🔙 Back: Safely returns you to the Active Inventory list, preserving your filters.
- ⏸️ Pause Stream / ▶️ Resume Stream: If you have an antenna processing hundreds of sensors per second, the frame log will fly by. This button temporarily freezes the visual injection on the screen so you can read or analyze a specific packet, without disconnecting the underlying socket.
- 🗑️ Clear Consoles: Deletes all local history accumulated in the Frames table to clear the view and focus on new incoming packets.
2. Analysis Tabs
The console is divided into four professional monitoring Tabs:
Tab 1: Dashboard (Metrics and Status)
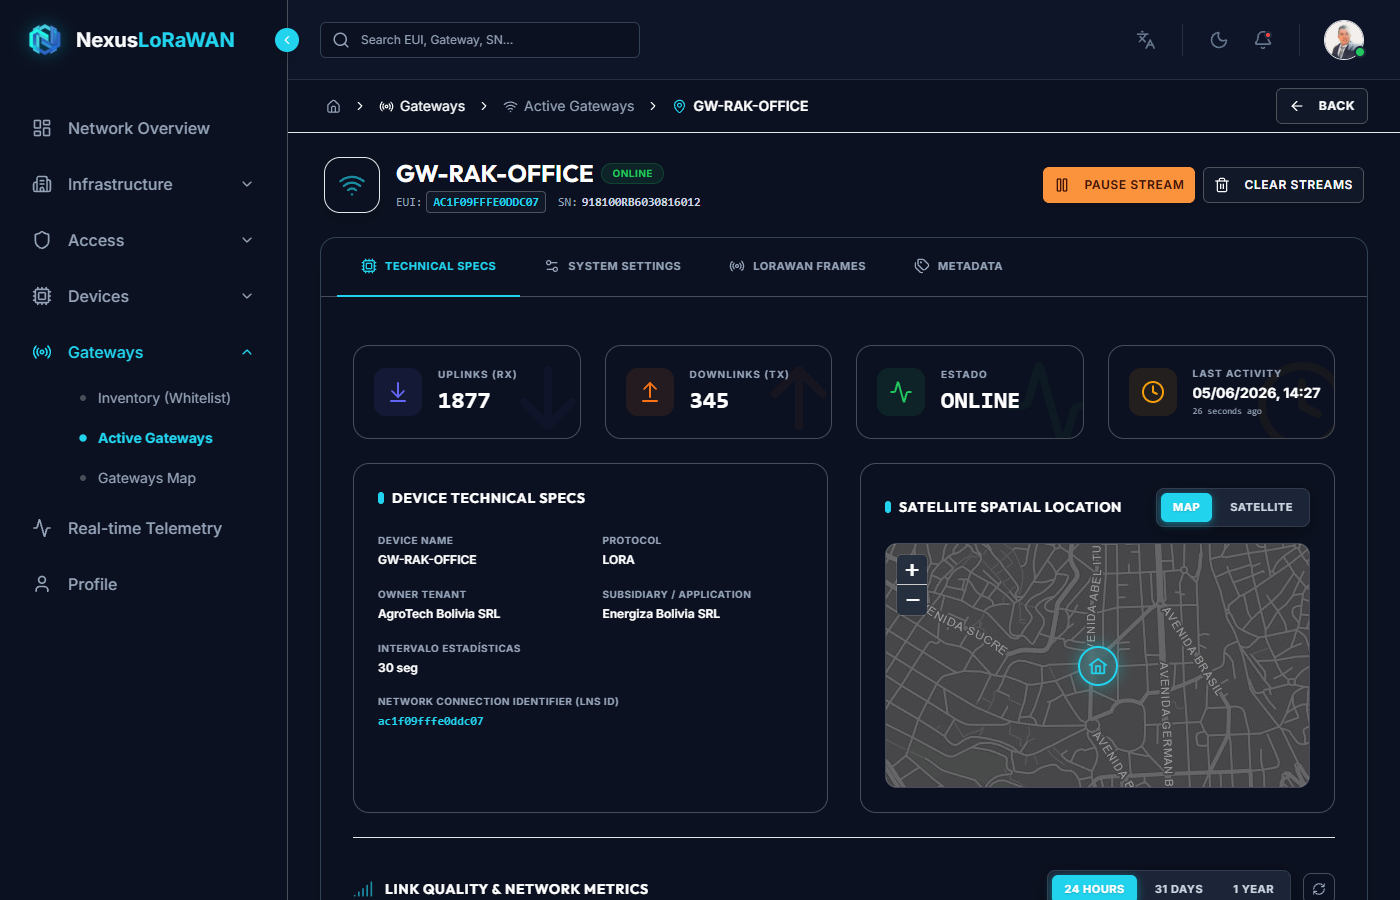
This is the panoramic view of the antenna. It combines rapid telemetry with historical network statistics:
- Top Cards (KPIs): Visually total the Uplinks (RX) and Downlinks (TX) received since you opened the monitor. They show the connection status and "Last Activity" with relative formatting (
3 seconds ago). - Technical Specifications: A summary of identity (Tenant, Subsidiary, Protocol) and its
LoRaWAN Network Server Native ID. - Mini Location Map: An interactive geospatial viewer where you can toggle between Street Map or Satellite topography using the switcher buttons in the corner.
- Link Quality and Metrics (Charts): A powerful suite of statistical analysis. It includes quick buttons to load historical data (
24h,31d,1y) and a refresh button. It displays advanced charts such as:- Uplinks and Downlinks over time (Trend lines).
- RX / TX Packets by Frequency (Bars denoting Lora channel saturation).
- RX / TX Packets by DataRate (Bars evaluating how far or modulated the sensors are - SF7 to SF12).
Tab 2: Configuration (Config)
Shows the hardware's metadata and isolation parameters.
- IDENTIFICATION & NETWORK PROFILE: Exposes the Gateway EUI and the Serial Number (SN).
- Copy to Clipboard Button: Next to the EUI you will find a small quick-copy icon, ideal for pasting the ID into SSH terminals when configuring the physical Packet Forwarder on the antenna.
- Transfer Gateway: Allows you to move the physical ownership of this antenna to another Distributor (Tenant) or Branch (Subsidiary) within the ecosystem. This updates the record in Lumiot and destructively recreates the gateway in LNS to maintain security and isolation consistency.
- Superadmin: Has global privileges. Can transfer the Gateway to any Tenant across the entire platform and to any of their respective Subsidiaries.
- Integrator: Has limited scope bound to their own ecosystem. Can only transfer the Gateway between the Subsidiaries (Branches) that belong to their own Tenant; the target Tenant selection will be locked for them.
Clicking TRANSFER will open a high-security modal that guides you step-by-step:
- Select Target Tenant: Select the distributor you wish to send the equipment to (Available only to Superadmins).
- Select Subsidiary (Branch): Define the workgroup or end customer that will receive the equipment.
- Migration Warning: You will be notified that all current data and configuration of the gateway will be reassigned. Confirm the changes using the transfer button and the migration will proceed in real-time.
Tab 3: Frames (Radio Frequency Console)
The technical heart of the platform. A tabular console (DataGrid) injected at super-high speed that allows you to audit the physical layer (PHY) of everything the antenna hears.
- Real-Time Columns:
- Exact frequency (
e.g., 915.200 MHz). - Lora modulation Datarate (
e.g., SF7). - Received Signal Strength Indication (
RSSIin dBm). - Signal-to-Noise Ratio (
SNR). - Packet Size (
Size) and Counters (fCnt).
- Exact frequency (
- Clicking the "View Details" eye opens a side drawer with the raw JSON (
rx_info,tx_info,phy_payload), perfect for debugging codecs or deciphering collisions.
Tab 4: Metadata
Renders the complete JSON tree of all variables, custom Tags, and raw location that have been injected into this Gateway from the platform to LoRaWAN Network Server. It serves as technical proof that custom parameters are successfully syncing with the network server.